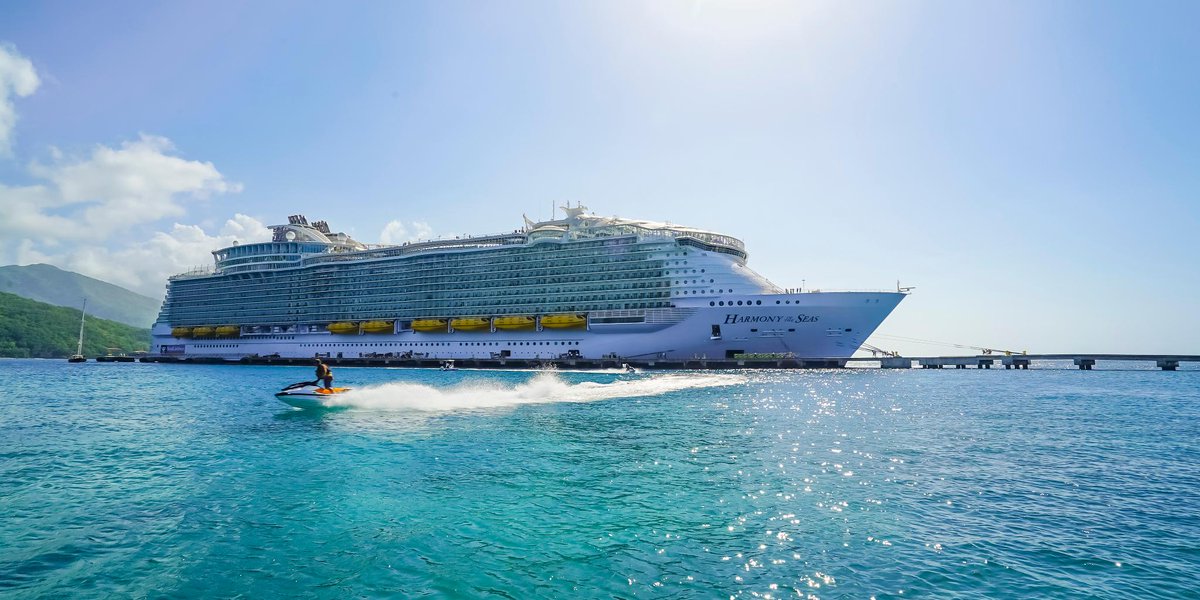
It’s no secret that cruise ships visiting Sint Maarten are crucial to the local economy. They bring in thousands of passengers, many of whom have never visited the island. And while cruises normally only stay in port for the day, that may be a good thing. The average daily expenditure per cruise passenger in Sint Maarten (per Sint Maarten Dept of Statistics 2015 Survey) was $205.86. That’s almost $130 more per day than the average amount of $75.90 spent per day by overnight visitors.
After Irma hit, the first cruise ship arrived in port Sint Maarten on December 4, 2017. It was a beautiful site for many who call the island home and a sign that the tourism industry, which supports nearly 90% of the economy of the island, was back open once again.
According to the Sint Maarten Department of Statistics, cruise traffic in both May and June 2018 hit record levels, which is welcome news and an encouraging sign. Not only does this show that the cruise lines are excited about the recovery of Sint Maarten following the devastating 2017 hurricane season, but it also shows there is a high level of demand from passengers wanting to visit this beautiful island.
Here are the cruise statistics from the Sint Maarten Department of Statistics for the months of May and June starting in 1995 through 2018. Check them out and I’ll meet you on the other side with more information.
| Cruise Vessels | Cruise Passengers | |||||
| MAY | JUN | Total | MAY | JUN | Total | |
| 1995 | 31 | 19 | 50 | 45,580 | 35,707 | 81,287 |
| 1996 | 25 | 19 | 44 | 38,564 | 37,815 | 76,379 |
| 1997 | 33 | 22 | 55 | 59,318 | 49,458 | 108,776 |
| 1998 | 26 | 19 | 45 | 52,186 | 43,091 | 95,277 |
| 1999 | 12 | 12 | 24 | 28,229 | 28,878 | 57,107 |
| 2000 | 23 | 21 | 44 | 51,424 | 39,831 | 91,255 |
| 2001 | 21 | 18 | 39 | 50,048 | 42,704 | 92,752 |
| 2002 | 22 | 23 | 45 | 54,643 | 59,847 | 114,490 |
| 2003 | 31 | 25 | 56 | 60,364 | 52,064 | 112,428 |
| 2004 | 33 | 32 | 65 | 60,364 | 52,064 | 112,428 |
| 2005 | 27 | 22 | 49 | 79,501 | 77,829 | 157,330 |
| 2006 | 30 | 20 | 50 | 89,624 | 69,248 | 158,872 |
| 2007 | 23 | 19 | 42 | 73,368 | 69,046 | 142,414 |
| 2008 | 18 | 16 | 34 | 57,983 | 59,273 | 117,256 |
| 2009 | 17 | 12 | 29 | 50,266 | 43,494 | 93,760 |
| 2010 | 23 | 22 | 45 | 79,074 | 84,889 | 163,963 |
| 2011 | 24 | 17 | 41 | 81,347 | 73,477 | 154,824 |
| 2012 | 19 | 18 | 37 | 76,476 | 77,211 | 153,687 |
| 2013 | 21 | 19 | 40 | 84,588 | 79,904 | 164,492 |
| 2014 | 31 | 25 | 56 | 115,385 | 102,517 | 217,902 |
| 2015 | 25 | 21 | 46 | 91,911 | 86,571 | 178,482 |
| 2016 | 22 | 18 | 40 | 81,747 | 76,985 | 158,732 |
| 2017 | 23 | 20 | 43 | 89,845 | 88,008 | 177,853 |
| 2018 | 30 | 27 | 57 | 120,907 | 120,266 | 241,173 |
As you can see, cruise ship arrivals over these two months were at their highest levels since May and June of 2004. In addition, cruise passengers were at the highest level ever reported by the DOS for the months of May and June. This is a huge boost to the island and it also illustrates that there are a lot of people making their way back to SXM.
That’s the good news. However, if we look deeper into the numbers we can see there’s still a long way to go to get to a complete recovery.
Total cruise passengers year-to-date through June were down over 27% from 2017 (1,011,608 passengers) compared to 2018 (733,666). That’s an improvement, thanks to the record setting months of May and June, from an over 41% decline in cruise passengers through the first four months of 2018.
Overnight visitors were also way down year-over-year through June by over 221,000 visitors. That’s a decrease of nearly 75% when comparing 2018 (74,474) to 2017 (296,570). And, per the DOS survey, overnight visitors stay an average of 7.7 nights. That’s a year-over-year reduction of 1,701,700 visitor nights.
If we look at the annual estimated economic impact due to the decline in tourism from 2017 to 2018, we get the following numbers:
Overnight visitors – 221,000 x 7.7 (avg # of nights per visitor) = 1,701,700 visitor nights x $75.90 = $129,159,030 in lost revenue
Cruise passengers – 277,942 x $205.86 = $57,217,140 in lost revenue
Total lost revenue in 2018 through June was approximately $186 million. That’s a sobering reminder of the impact of the 2017 hurricane season. It’s also a great reason to plan a trip to the Friendly Island to help continue the trend we saw from increasing cruise passenger traffic in May and June.
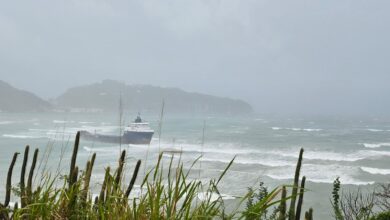
This past week was the most active since the hurricane season began, and fortunately the island has avoided any major storms thus far. Getting through this season without any big storms would be an enormous step forward to complete recovery for the island of Saint Martin.
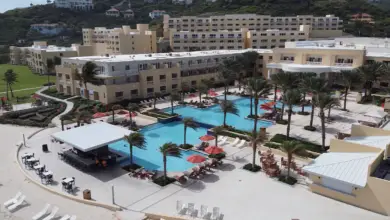
Work continues on the terminal at Princess Juliana International Airport, with the projected transfer of the departure and arrival operations to the ground floor of the Terminal Building in November 2018, just in time for the next high season.
One thing is clear – All the pieces are in place for an incredible 2018/19 season. Now, the weather just needs to cooperate.
Show your support for Saint Martin/Sint Maarten with an SXM Strong t-shirt or hat. Proceeds go directly to assist local residents and communities on the island.